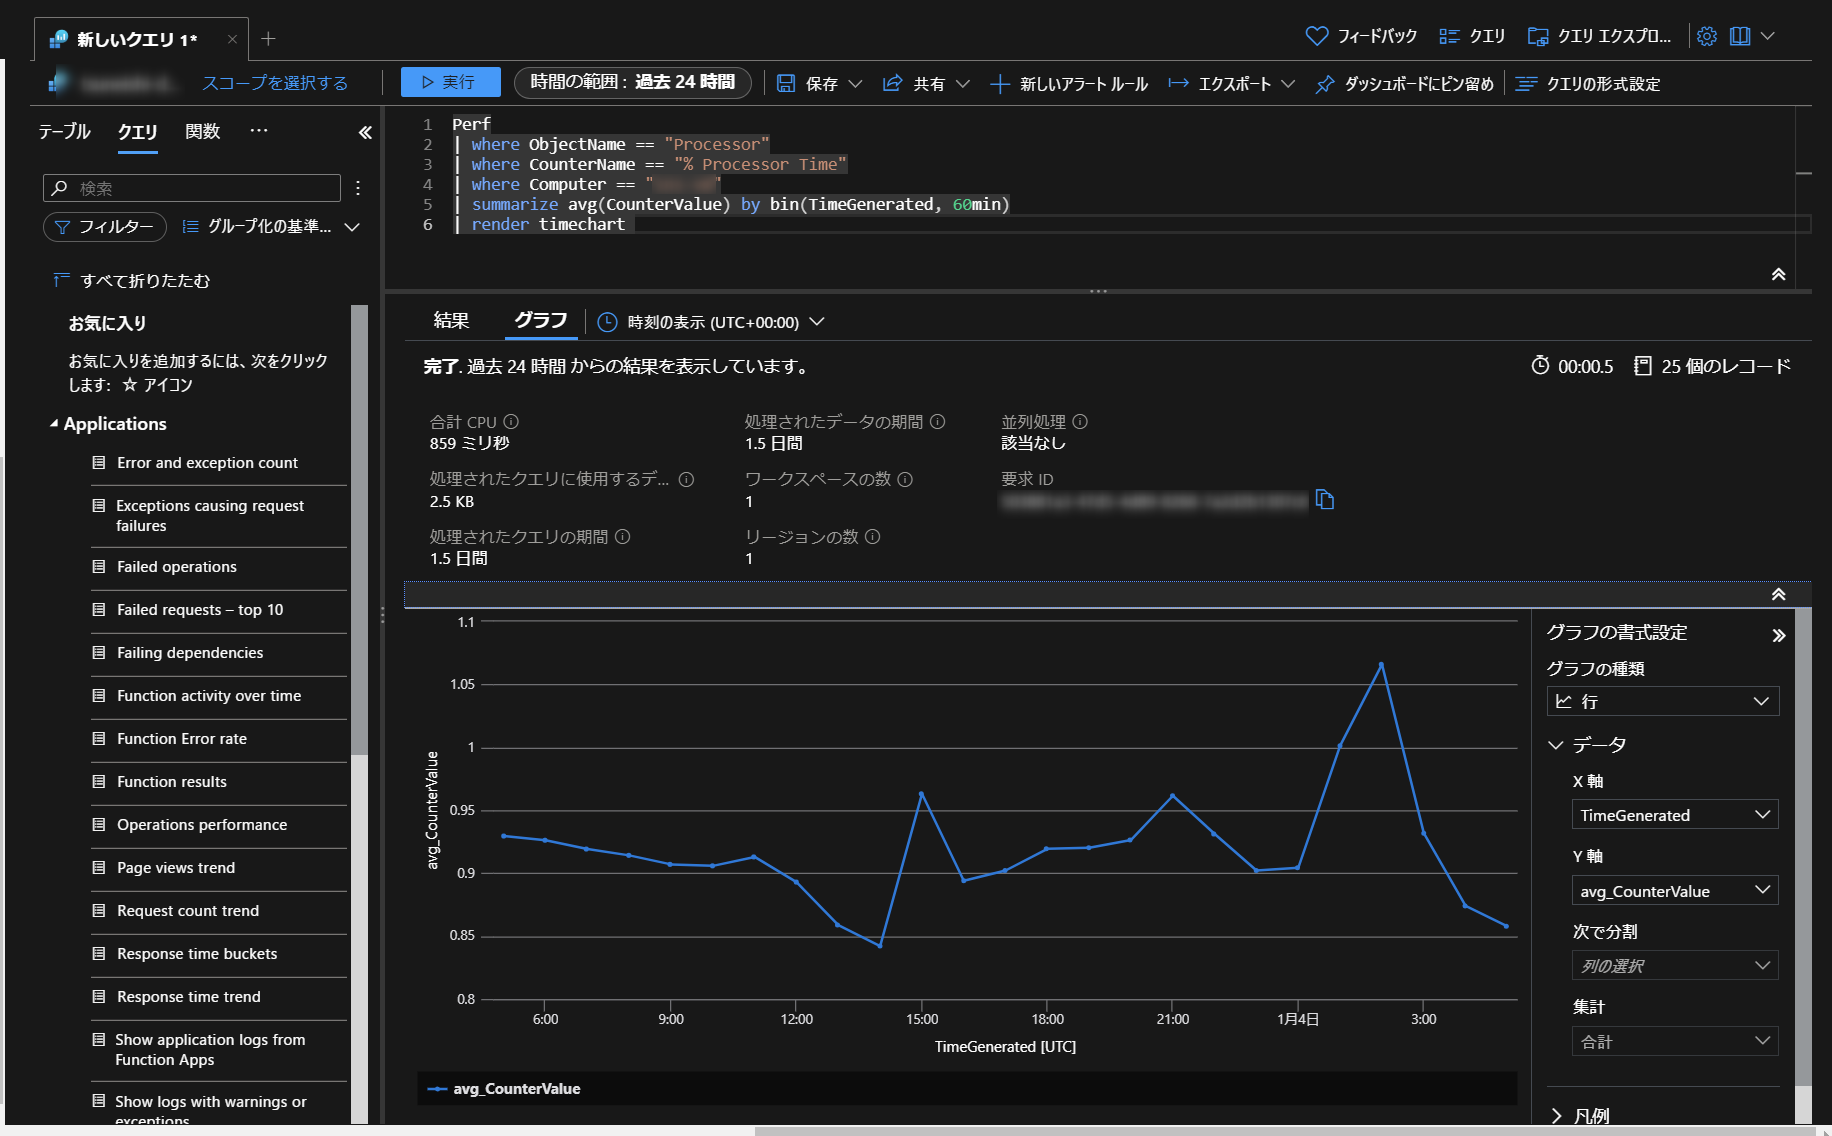
summarizeでキーを作成、renderでtimechartを指定する
Perf
| where ObjectName == "Processor"
| where CounterName == "% Processor Time"
| where Computer == "<ComputerName>"
| summarize avg(CounterValue) by bin(TimeGenerated, 60min)
| render timechart
summarizeでキーを作成、renderでtimechartを指定する
Perf | where ObjectName == "Processor" | where CounterName == "% Processor Time" | where Computer == "<ComputerName>" | summarize avg(CounterValue) by bin(TimeGenerated, 60min) | render timechart